3 Metrics To Improve Medium’s Crummy Analytics Dashboard
In 2015, Evan Williams, the creator of Medium, criticised the standard web traffic metric of unique visitors as “a highly volatile and meaningless number for what we’re trying to do.”¹ Eight years later, the primary metric for Medium’s analytics is views — which are almost as useless as unique visitors when Medium doesn’t allow us to be selective with the data.
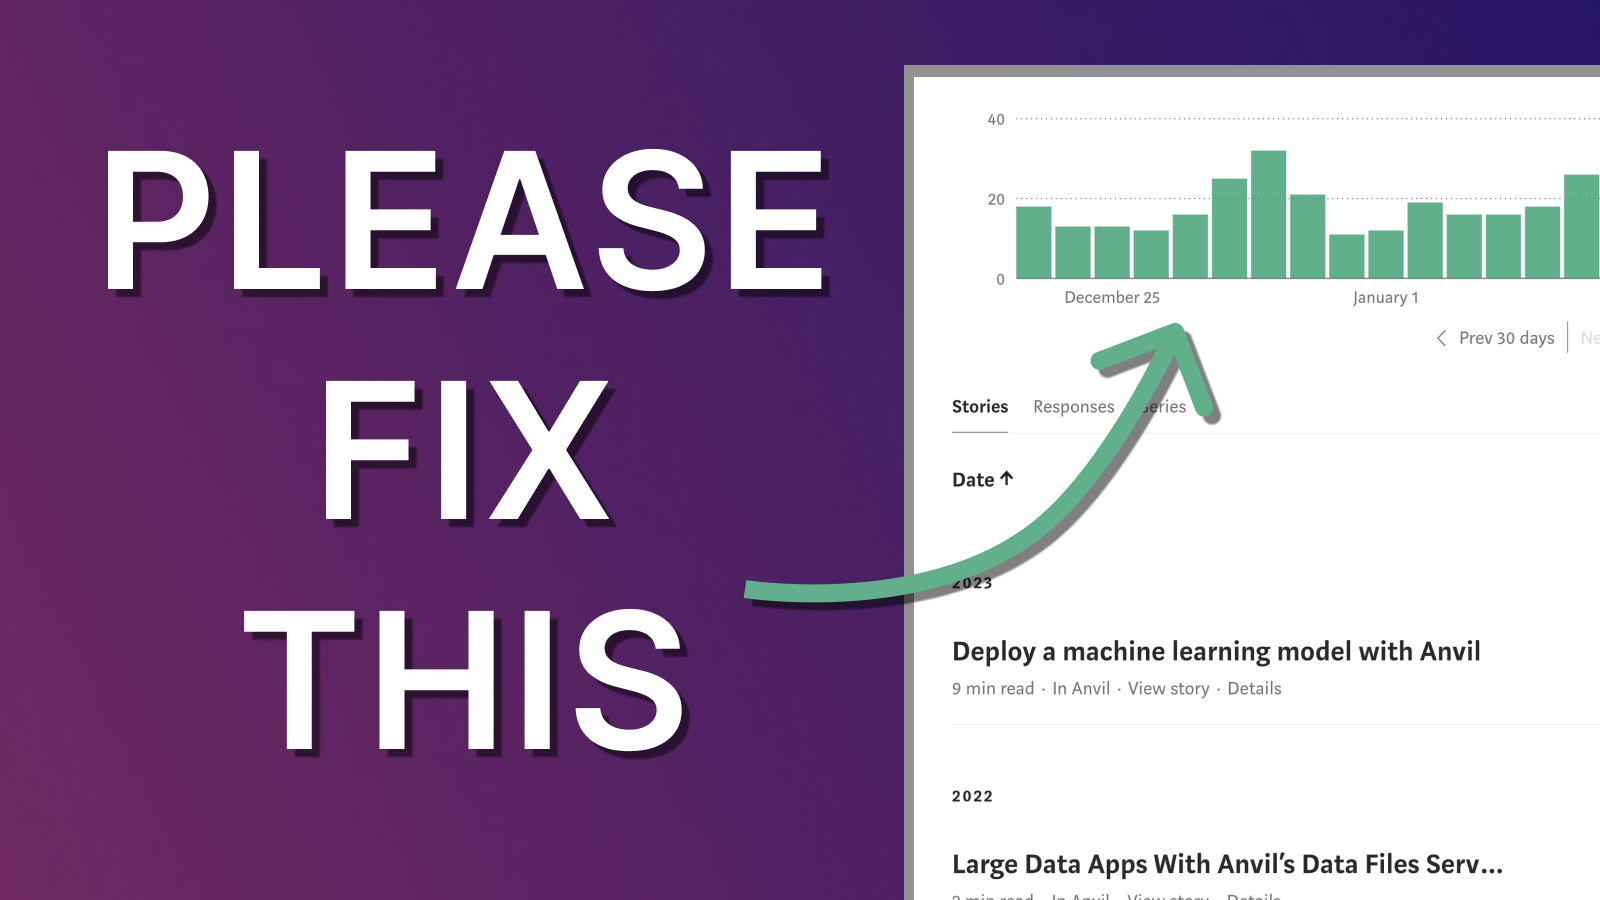
Medium’s analytics can be incredibly frustrating for us writers who want to make adjustments and optimise our writing based on data. So, let’s explore how the analytics dashboard can be improved.
Date Ranges
Medium’s analytics would greatly benefit from the ability to see data within specific date ranges. Currently, the only date range available is a 30-day segment and it shows the cumulative views for all posts.
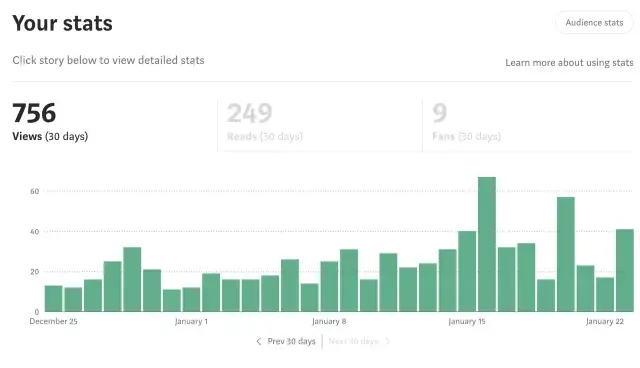
If we could view data for a given date range, for specific articles, it would provide a more detailed understanding of how our content is performing. This would enable us writers to identify patterns and trends in our content, such as which days of the week tend to generate more views or how an article has performed over a longer period.
Comparison
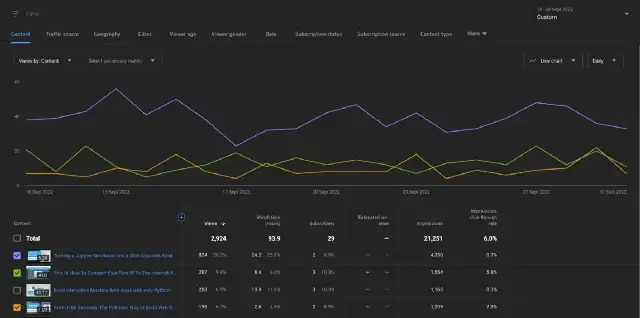
Another improvement would be the ability to compare one story to another. This would let us identify which types of content are resonating with readers and which are not.
At the moment, we can only track the total views of our articles over their lifetime. This gives us a very rough idea of what’s resonating but if you’ve been writing for multiple years, it makes the data too fuzzy.
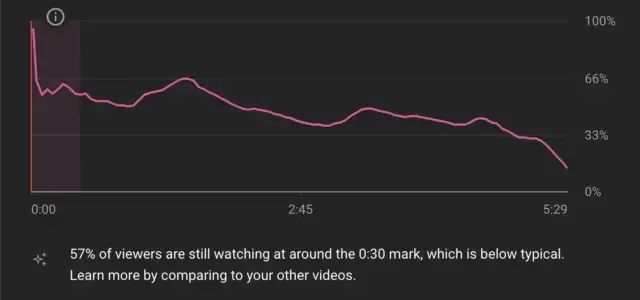
Percentage Read
Finally, the ability to see what percentage of a blog post was read by visitors would be incredibly useful. This would give us a better understanding of how engaged readers are with our content and where they are dropping off. By identifying where readers are losing interest, we can make changes to keep them engaged, such as adding more visuals, breaking up long paragraphs, or simplifying the language.
I love writing on Medium, the writers on there and features are great. But please, let’s move away from highly volatile and meaningless numbers.
References
[1] Hempel, Jessi (April 14, 2015). “Ev Williams’ Rules for Quality Content in the Clickbait Age”. Wired. April 14, 2015.
Thanks for reading!
If you found this article useful and can spare a dollar, I’d appreciate the support.
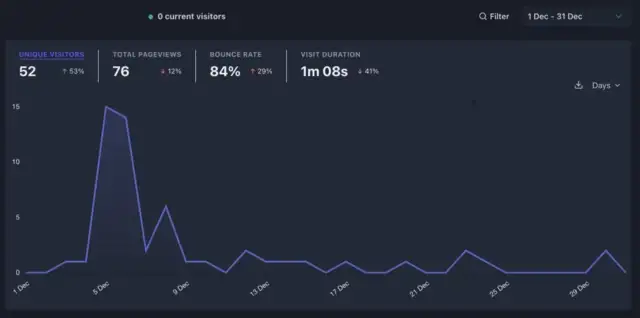
I believe in privacy and I don’t run ads. For analytics, I use the open-source platform Plausible.


